The
Perception of the Speed
of the Passage of Time
at Different Ages of Life.
Preamble
Remember when you were a kid, and you thought time went by so slowly? What about now!!? Time seems to be racing by at a breakneck speed!
What I have below is my hypothesis of the main reason there is an intuitive, baseline perception that time, e.g., a year (or a week!), seems to go by faster as you get older.
I thought the idea presented below to explain this concept of the difference in perception of the speed of the passage of time as we age might be an original idea of mine from my own past, but further investigation shows that French philosopher Paul Janet proposed the basic idea in 1877 - so I probably read about it somewhere along the way. (The elaboration of the implied mathematical relationships involved, as well as the Excel table, vertical bar graphs, and formulas below, however, are my own to illustrate the concept more fully.).
Using the process below, you will be able to quantify and compare the perception of the speed of the passage of time between two people of different ages – or yourself now and when you were younger.
I see the following explanation below as a baseline. Of course, other activities, situations, and environment would influence a person’s particular perception of the speed of the passage of time during certain events and periods of a person’s life.
The basic proposal is based on the concept of a year being perceived as a PROPORTION of the number of years you have already lived – and the year then being used as a changing, dynamic reference point for the perception of the speed of the passage of time as you age. Yearly, seasonal, natural cycles would also aid in resetting this dynamic reference point.
Introduction
At the completion of a particular year that you have lived after birth, i.e., your Age on your birthday, then the length of time that previous one year represents of your life lived so far is the proportion 1/Age. This proportion could then be changed into percentage form by multiplying that proportion by 100.
For example, on your fifth birthday, that previous year represents 1/5 = 0.20 = 20% of your life lived so far. For another example, on your 40th birthday, that previous year represents 1/40 = 0.025 = 2.5% of your life lived so far. Likewise, on your 80th birthday, that previous year represents 1/80 = 0.0125 = 1.25% of your life lived so far.
From the examples above, in comparison to the five-year-old, using the dynamic year as the reference point, especially note that time would seem to go eight times as fast for the forty-year-old (20% / 2.5%) - and sixteen times faster for the eighty-year-old (20% / 1.25%).
As an example of a further deduction from a different perspective, as explained below, this would also result in the perception of the speed of the passage of time as a 25.15% increase for an eighty-year-old in comparison to himself as a sixty-year-old.
Generalizing
Let %DynamicYearAge = the percentage ONE year is of the number of years already lived = 100%*(1/Age), i.e., = (100/Age)%
where Age = Age in Years
For example, the %DynamicYearAge for a five-year-old would be 20%.
Then, for comparative purposes between two people (or the same person at different ages), further identify a particular person with the following notation as being the younger or the older as follows:
%DynamicYearAge younger or %DynamicYearAge older
Then, in general, the comparative perception of the speed of the passage of time for an older person of a particular age relative to a younger person of a particular age would be the result of
(%DynamicYearAge younger) / (%DynamicYearAge older)
Note that the results from the above would be reported that the older person’s comparative perception of time is FASTER by a certain factor as calculated.
For example, if you are 80 years old, then you would perceive the speed of the passage of time 1.34 times faster than when you were 60 years old (1.67% / 1.25%) = 1.34).
Also note that this results in a 25.15% increase of the perception of the speed of the passage of time, since 0.42%/1.67% = 25.15%, where 0.42% is the difference between %DynamicYearAge younger and %DynamicYearAge older.
This is a 0.42% decrease in the proportion of time one year represents – which then would be perceived as a 25.15% increase in the speed of the perception of the passage of time.
Another way to look at this would be the reverse by switching the relative ages:
%DynamicYearAge older) / (%DynamicYearAge younger)
In this case, the results would be reported from the opposite perspective, i.e. the younger person’s perception of time is SLOWER by a certain factor. For example, a five-year-old’s perception of the speed of the passage of time would be slower by a factor of (2.5% / 20%) = 1/8 = 12.5% when compared to that of a forty-year-old.
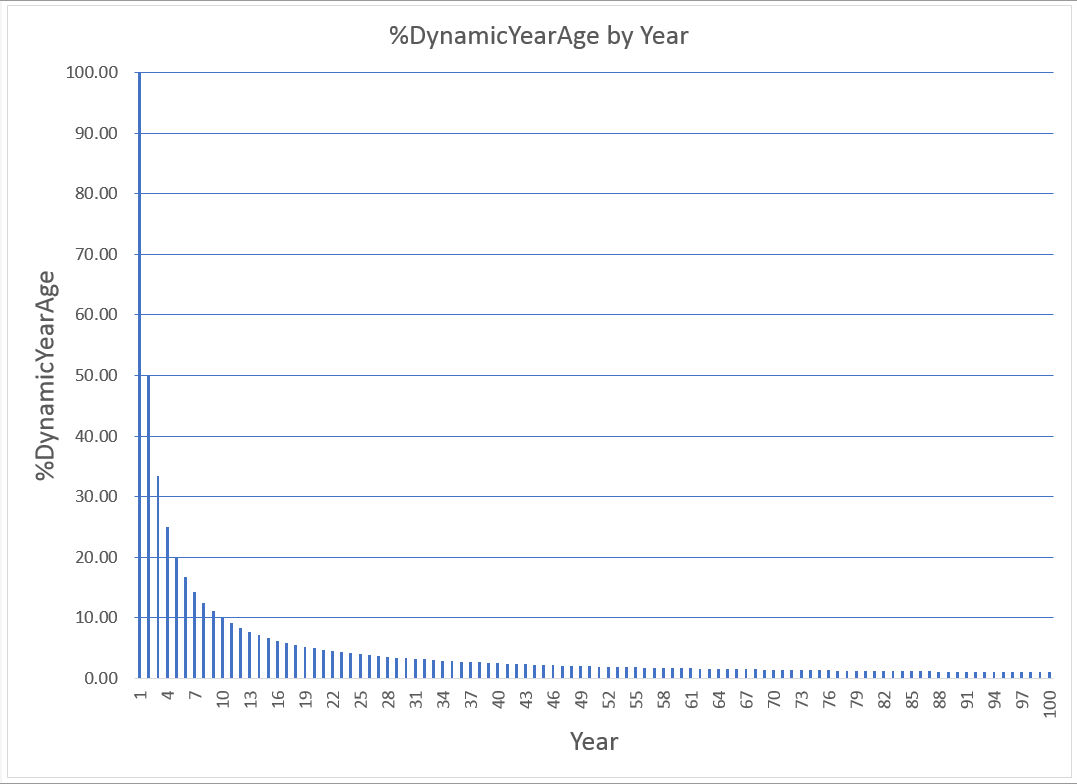
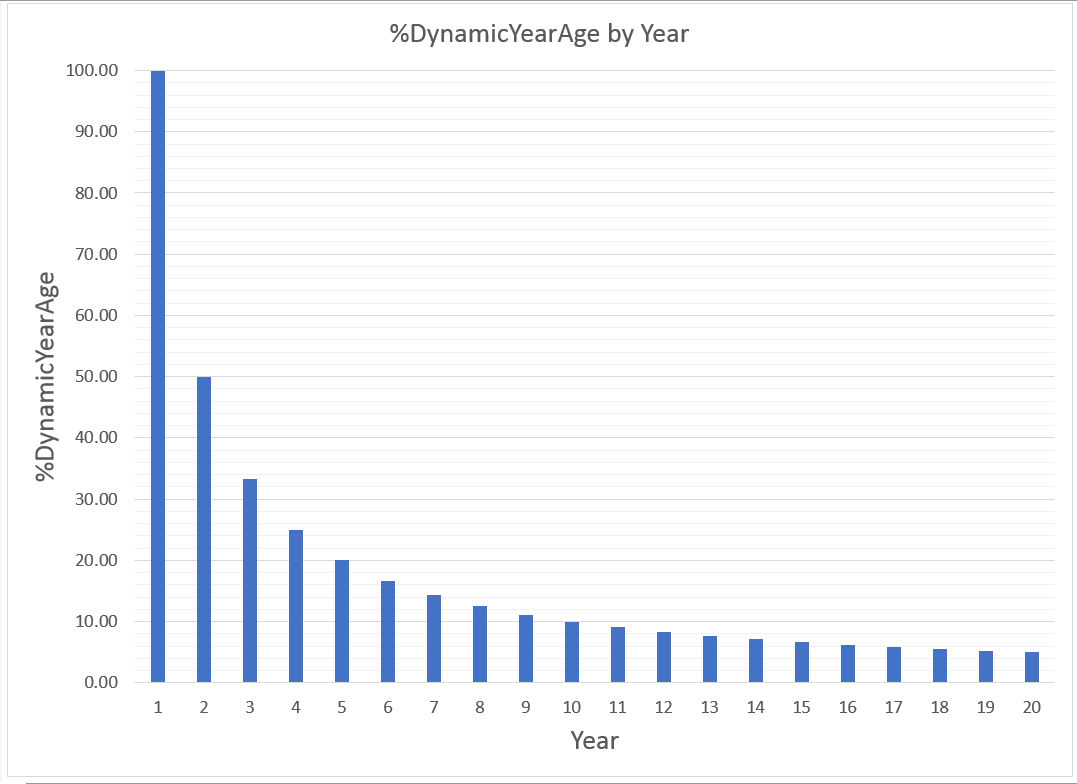
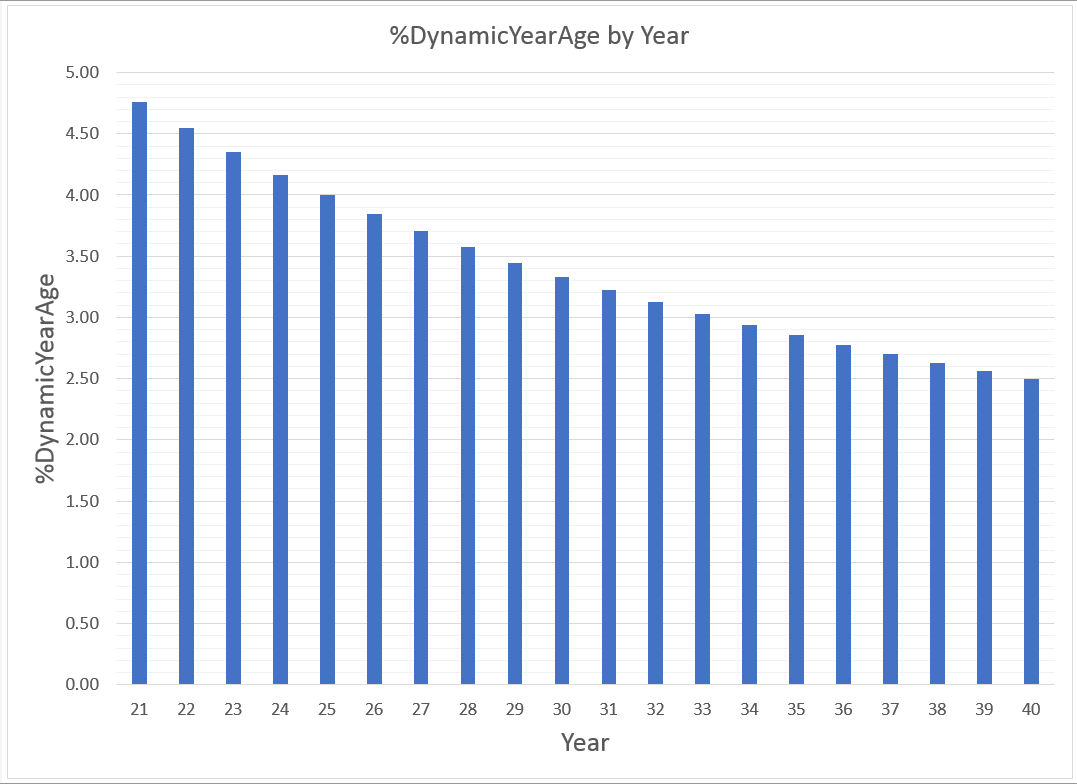
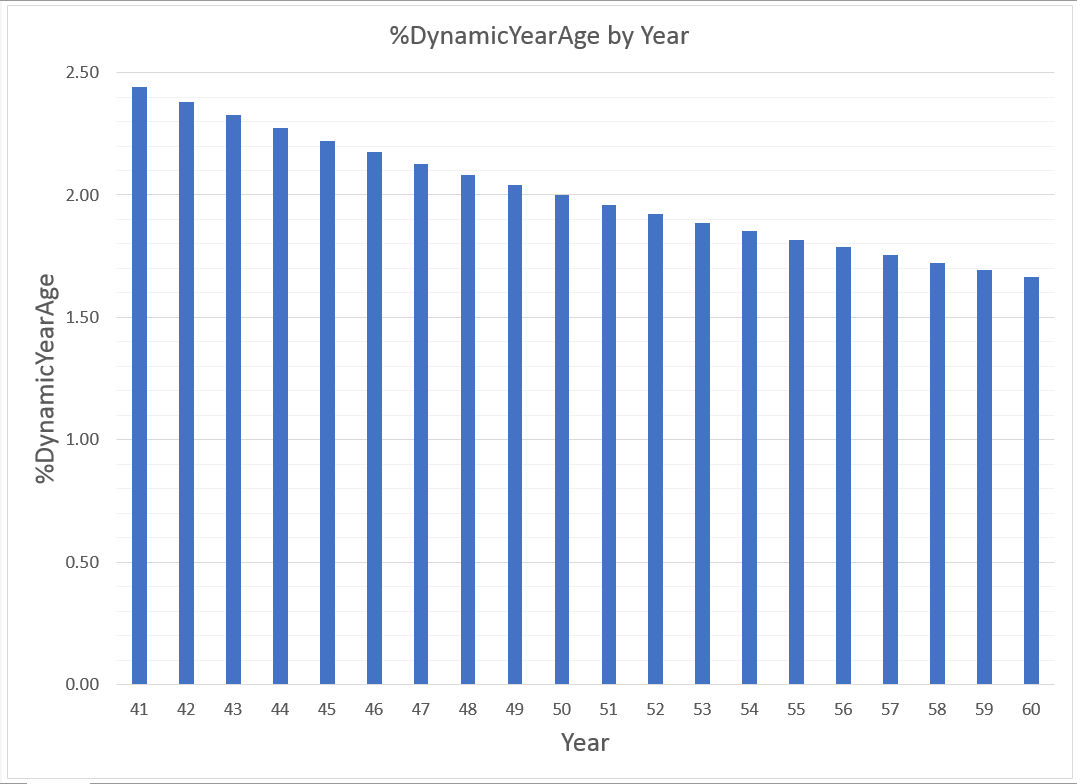
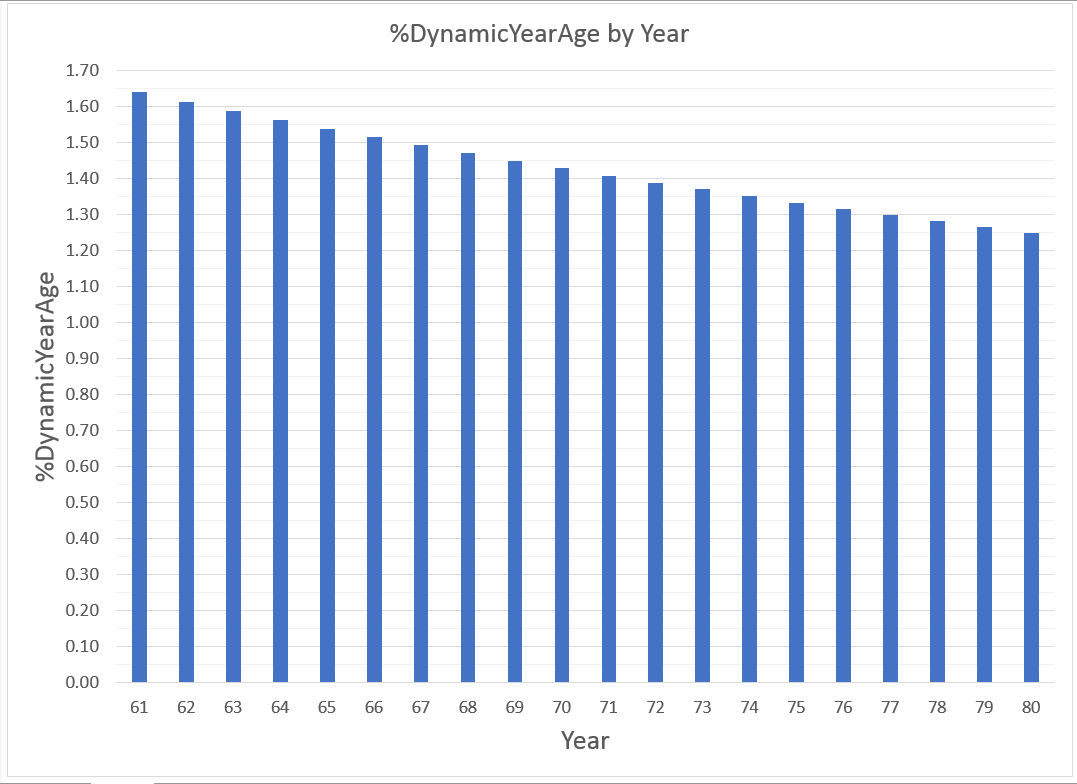
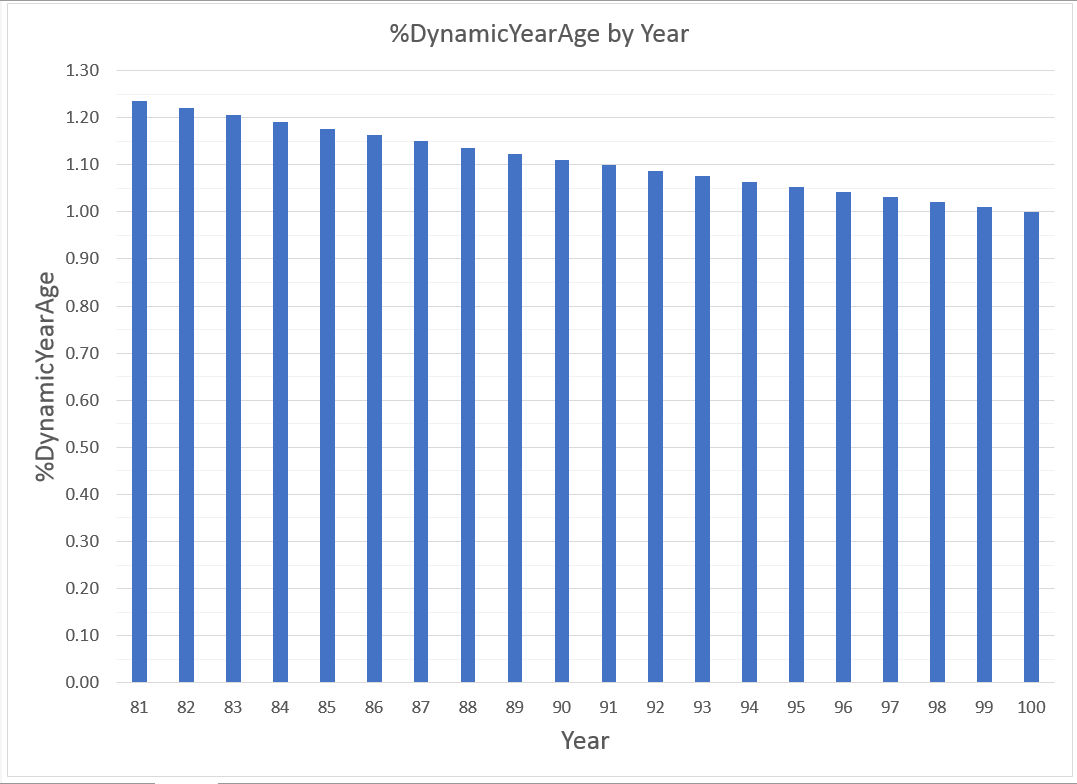
Resource of %DynamicYearAge values and Vertical Bar Graphs
See the table below for the %DynamicYearAge values for particular ages, as well as the vertical bar graphs overall and for different age groups. Those values in the table can then be used to calculate the factor of the relative perception of the speed of the passage of time between two people of different ages as illustrated above.
%DynamicYearAge values for particular ages
| Year | %DynamicYearAge |
| 1 | 100.00 |
| 2 | 50.00 |
| 3 | 33.33 |
| 4 | 25.00 |
| 5 | 20.00 |
| 6 | 16.67 |
| 7 | 14.29 |
| 8 | 12.50 |
| 9 | 11.11 |
| 10 | 10.00 |
| 11 | 9.09 |
| 12 | 8.33 |
| 13 | 7.69 |
| 14 | 7.14 |
| 15 | 6.67 |
| 16 | 6.25 |
| 17 | 5.88 |
| 18 | 5.56 |
| 19 | 5.26 |
| 20 | 5.00 |
| 21 | 4.76 |
| 22 | 4.55 |
| 23 | 4.35 |
| 24 | 4.17 |
| 25 | 4.00 |
| 26 | 3.85 |
| 27 | 3.70 |
| 28 | 3.57 |
| 29 | 3.45 |
| 30 | 3.33 |
| 31 | 3.23 |
| 32 | 3.13 |
| 33 | 3.03 |
| 34 | 2.94 |
| 35 | 2.86 |
| 36 | 2.78 |
| 37 | 2.70 |
| 38 | 2.63 |
| 39 | 2.56 |
| 40 | 2.50 |
| 41 | 2.44 |
| 42 | 2.38 |
| 43 | 2.33 |
| 44 | 2.27 |
| 45 | 2.22 |
| 46 | 2.17 |
| 47 | 2.13 |
| 48 | 2.08 |
| 49 | 2.04 |
| 50 | 2.00 |
| 51 | 1.96 |
| 52 | 1.92 |
| 53 | 1.89 |
| 54 | 1.85 |
| 55 | 1.82 |
| 56 | 1.79 |
| 57 | 1.75 |
| 58 | 1.72 |
| 59 | 1.69 |
| 60 | 1.67 |
| 61 | 1.64 |
| 62 | 1.61 |
| 63 | 1.59 |
| 64 | 1.56 |
| 65 | 1.54 |
| 66 | 1.52 |
| 67 | 1.49 |
| 68 | 1.47 |
| 69 | 1.45 |
| 70 | 1.43 |
| 71 | 1.41 |
| 72 | 1.39 |
| 73 | 1.37 |
| 74 | 1.35 |
| 75 | 1.33 |
| 76 | 1.32 |
| 77 | 1.30 |
| 78 | 1.28 |
| 79 | 1.27 |
| 80 | 1.25 |
| 81 | 1.23 |
| 82 | 1.22 |
| 83 | 1.20 |
| 84 | 1.19 |
| 85 | 1.18 |
| 86 | 1.16 |
| 87 | 1.15 |
| 88 | 1.14 |
| 89 | 1.12 |
| 90 | 1.11 |
| 91 | 1.10 |
| 92 | 1.09 |
| 93 | 1.08 |
| 94 | 1.06 |
| 95 | 1.05 |
| 96 | 1.04 |
| 97 | 1.03 |
| 98 | 1.02 |
| 99 | 1.01 |
| 100 | 1.00 |
| Front Page |
Dr. Winstead's Blood Pressure Tracker: Free Templates for Graphing Blood Pressure in Microsoft Excel
Dr. Winstead's Current Local and World Standard Percentage Metric Time Clock